[선형대수] 클러스터링(Clustering)이란?

머신러닝(Machine Learning)

지도 학습(Supervised Learning)

  • 데이터에 라벨이 있는 경우 사용할 수 있다.

분류(Classification)

  • 주어진 데이터의 카테고리 혹은 클래스 예측을 위해 사용된다.

회귀(Regression)

  • 컨티뉴어스(Continuous)한 데이터를 바탕으로 결과를 예측하기 위해 사용된다.

비지도 학습(Unsupervised Learning)

클러스터링(Clustering)

  • 데이터의 연관된 피쳐를 바탕으로 유사한 그룹을 생성한다.

image

차원 축소(Dimensionality Reduction)

  • 높은 차원을 갖는 데이터셋을 사용하여 피쳐 선택(Feature Selection), 추출(Extraction) 등을 통해 차원을 줄이는 방법이다.

연관 규칙 학습(Association Rule Learning)

  • 데이터셋의 피쳐들의 관계를 발견하는 방법이다.

강화 학습(Reinforcement Learning)

  • 머신러닝의 한 형태로 기계가 좋은 행동에 대해서는 보상, 그렇지 않은 행동에는 처벌이라는 피드백을 통해, 행동에 대해 학습해 나가는 형태이다.

치트 시트

클러스터링(Clustering)

  • 클러스터링은 비지도 학습 알고리즘의 한 종류이다.

목적

  • 클러스터링이 대답할 수 있는 질문은 주어진 데이터들이 얼마나, 어떻게 유사한 지 이다.
  • 주어진 데이터셋을 요약, 정리하는데 있어 매우 효율적인 방법들 중 하나로 사용되고 있다.
  • 동시에 정답을 보장하지 않는다는 이슈가 있어서 프로덕션(Production)의 수준, 혹은 예측을 위한 모델링에 쓰이기 보다 EDA를 위한 방법으로서 많이 쓰인다.

종류

계층적 군집화(Hierarchical)

Agglomerative

  • 개별 포인트에서 시작 후 점점 크게 합쳐간다.

Divisive

  • 하나의 큰 클러스터에서 시작 후 점점 작은 클러스터로 나눠간다.

Point Assignment

  • 시작 시에 클러스터의 수를 정한 다음, 데이터들을 하나씩 클러스터에 배정시킨다.

하드, 소프트(Hard vs Soft)

  • 하드 클러스터링에서 데이터는 하나의 클러스터에만 할당된다.
  • 소프트 클러스터링에서 데이터는 여러 클러스터에 확률을 갖고 할당된다.
  • 일반적으로 하드 클러스터링을 클러스터링이라고 칭한다.

유사성(Similarity)

  • Euclidean
    • 일반적으로 유클리디안이 많이 쓰인다.
  • Cosine
  • Jaccard
  • Edit Distance
  • etc

유클리디안(Euclidean)

1
2
3
4
5
6
7
import numpy as np

x = np.array([1, 2, 3])
y = np.array([1, 3, 5])

dist = np.linalg.norm(x-y)
dist

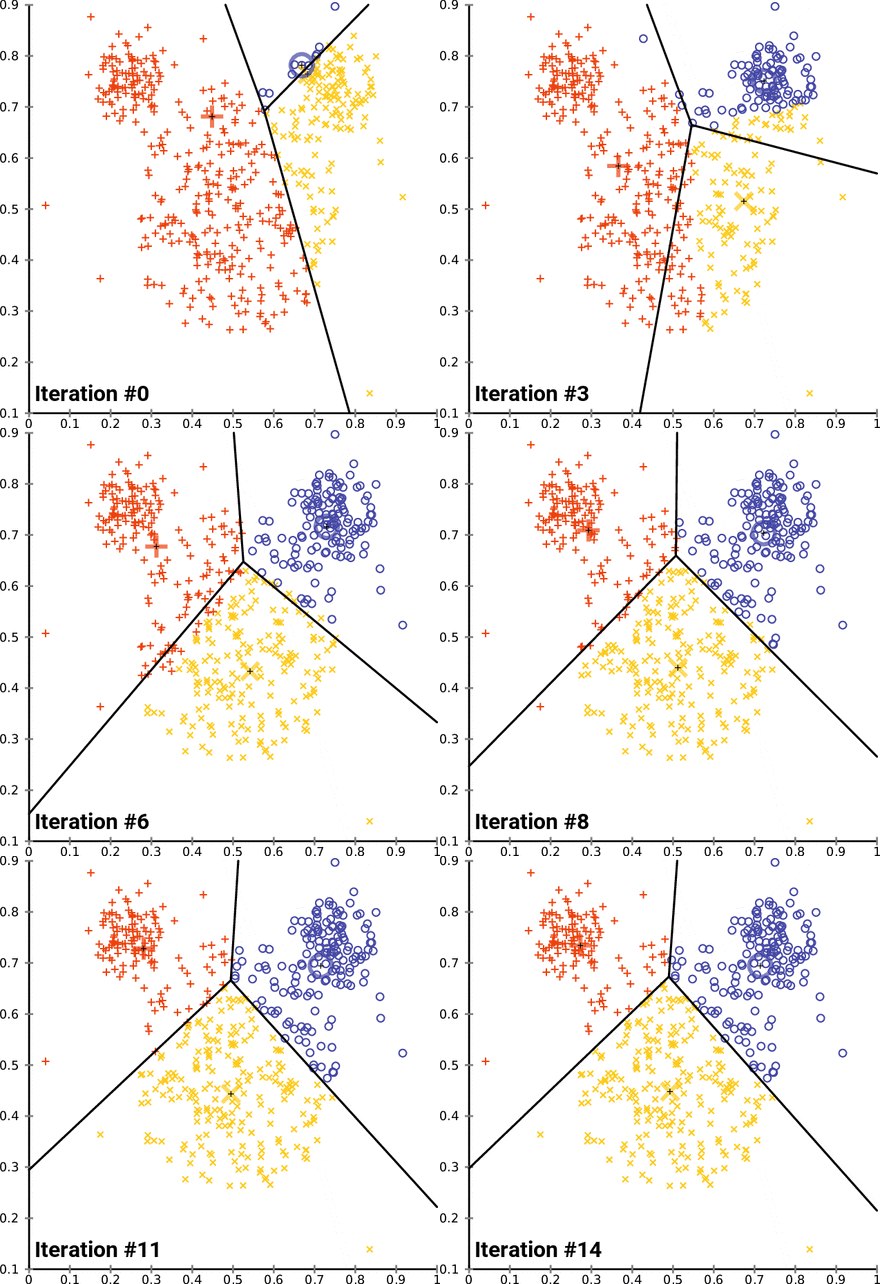
K-평균 군집화(K-means Clustering)

K-means Clustering

과정

  • n차원의 데이터에 대해,
    • 1) k개의 랜덤한 데이터를 클러스터의 중심점으로 설정한다.
    • 2) 해당 클러스터에 근접해 있는 데이터를 클러스터로 할당한다.
    • 3) 변경된 클러스터에 대해서 중심점을 새로 계산한다.
  • 클러스터에 유의미한 변화가 없을 때 까지 2-3회 반복한다.

튜토리얼

1
2
3
4
5
6
7
8
9
10
11
12
13
import pandas as pd
import matplotlib.pyplot as plt
from sklearn.datasets import make_blobs

x, y = make_blobs(n_samples = 100, centers = 3, n_features = 2)
df = pd.DataFrame(dict(x = x[:, 0], y = x[:, 1], label = y))

colors = {0 : '#eb4d4b', 1 : '#4834d4', 2 : '#6ab04c'}
fig, ax = plt.subplots()
grouped = df.groupby('label')
for key, group in grouped:
    group.plot(ax = ax, kind = 'scatter', x = 'x', y = 'y', label = key, color = colors[key])
plt.show()                  

image

1
2
3
4
5
points = df.drop('label', axis = 1) # label 삭제 


plt.scatter(points.x, points.y)
plt.show()

image

중심점(Centroid) 계산

  • K-평균은 중심점 베이스(Centroid-based) 알고리즘으로도 불린다.
  • Centroid란, 주어진 클러스터 내부에 있는 모든 점들의 중심 부분에 위치한 가상의 점이다.
1
2
3
4
5
6
7
8
9
10
11
12
13
14
dataset_centroid_x = points.x.mean()
dataset_centroid_y = points.y.mean()

print(dataset_centroid_x, dataset_centroid_y)
'''
-0.5316497686409459 -3.8350266662423365
'''


ax.plot(points.x, points.y)
ax = plt.subplot(1,1,1)
ax.scatter(points.x, points.y)
ax.plot(dataset_centroid_x, dataset_centroid_y, "or")
plt.show()

image

랜덤한 포인트를 가상 클러스터의 중심점으로 지정

1
2
centroids = points.sample(3) # k-means with 3 cluster
centroids

image

그래프에 표기

1
2
3
4
5
6
ax = plt.subplot(1,1,1)
ax.scatter(points.x, points.y)
ax.plot(centroids.iloc[0].x, centroids.iloc[0].y, "or")
ax.plot(centroids.iloc[1].x, centroids.iloc[1].y, "oc")
ax.plot(centroids.iloc[2].x, centroids.iloc[2].y, "oy")
plt.show()

image

1
2
3
4
5
6
7
8
9
10
11
12
13
14
15
16
17
18
19
20
21
import math
import numpy as np
from scipy.spatial import distance

def find_nearest_centroid(df, centroids, iteration):
 
  # 포인트와 centroid 간의 거리 계산
  distances = distance.cdist(df, centroids, 'euclidean')
  
  # 제일 근접한 centroid 선택
  nearest_centroids = np.argmin(distances, axis = 1)
    
  # cluster 할당
  se = pd.Series(nearest_centroids)
  df['cluster_' + iteration] = se.values
  
  return df


first_pass = find_nearest_centroid(points.select_dtypes(exclude='int64'), centroids, '1')
first_pass.head()

image

1
2
3
4
5
6
7
8
9
10
11
12
def plot_clusters(df, column_header, centroids):
  colors = {0 : 'red', 1 : 'cyan', 2 : 'yellow'}
  fig, ax = plt.subplots()
  ax.plot(centroids.iloc[0].x, centroids.iloc[0].y, "ok") # 기존 중심점
  ax.plot(centroids.iloc[1].x, centroids.iloc[1].y, "ok")
  ax.plot(centroids.iloc[2].x, centroids.iloc[2].y, "ok")
  grouped = df.groupby(column_header)
  for key, group in grouped:
      group.plot(ax = ax, kind = 'scatter', x = 'x', y = 'y', label = key, color = colors[key])
  plt.show()
  
plot_clusters(first_pass, 'cluster_1', centroids)

image

. . .

1
2
3
4
5
centroids = get_centroids(fifth_pass, 'cluster_5')

sixth_pass = find_nearest_centroid(fifth_pass.select_dtypes(exclude='int64'), centroids, '6')

plot_clusters(sixth_pass, 'cluster_6', centroids)

image

1
2
3
4
5
6
# 유의미한 차이가 없을 때 까지 반복, 이번 경우에는 전체 cluster에 변화가 없는 것을 기준으로 하겠습니다.
convergence = np.array_equal(fifth_pass['cluster_5'], sixth_pass['cluster_6'])
convergence
'''
True
'''

K를 결정하는 방법

  • The Eyeball Method:사람의 주관적인 판단을 통해서 임의로 지정하는 방법이다.
  • Metrics: 객관적인 지표를 설정하여, 최적화된 k를 선택하는 방법이다.

싸이킷런(Scikit-learn)

1
2
3
4
5
6
7
8
9
10
11
12
13
14
15
16
from sklearn.cluster import KMeans 
kmeans = KMeans(n_clusters = 3)
kmeans.fit(x)
labels = kmeans.labels_

print(labels)
'''
[1 2 0 2 2 2 1 0 1 1 0 2 0 0 1 0 0 1 2 1 0 1 2 1 2 2 0 2 1 0 1 1 1 2 0 0 2
 2 1 2 0 2 0 2 2 1 0 0 0 0 2 2 1 2 2 2 1 2 2 1 2 1 0 2 0 2 0 2 2 2 1 1 0 1
 1 0 1 0 1 1 1 1 2 1 0 0 0 0 2 1 0 1 2 1 0 0 1 1 0 0]
'''


new_series = pd.Series(labels)
df['clusters'] = new_series.values
df.head()

image

1
2
centroids = get_centroids(df, 'clusters')
plot_clusters(df, 'clusters', centroids)

image

엘보우 메소드(Elbow methods)

1
2
3
4
5
6
7
8
9
10
11
12
13
sum_of_squared_distances = []
K = range(1, 15)
for k in K:
    km = KMeans(n_clusters = k)
    km = km.fit(points)
    sum_of_squared_distances.append(km.inertia_)


plt.plot(K, sum_of_squared_distances, 'bx-')
plt.xlabel('k')
plt.ylabel('Sum_of_squared_distances')
plt.title('Elbow Method For Optimal k')
plt.show()

image

시간 복잡도

  • K-평균 군집화 말고도 상당히 많은 클러스터링 알고리즘이 있으며, 각자 풀고자 하는 문제에 대해 최적화되어있다.
  • 최적화된 문제를 제외한 다른 부분에 장점을 보이지 못한다는 단점도 있다.
0%